The problem
Product, stock and order data sat in BaseLinker and Trendyol, with no single view across them. To see how many orders came in today, which products were selling, how orders and revenue moved month to month, or what was running low, someone had to open each platform by hand every day. Low stock was easy to notice too late.
What I built
A React and TypeScript dashboard that pulls stock, order and listing data from BaseLinker and Trendyol into PostgreSQL on a schedule, so leadership could see stock levels and orders in one place.
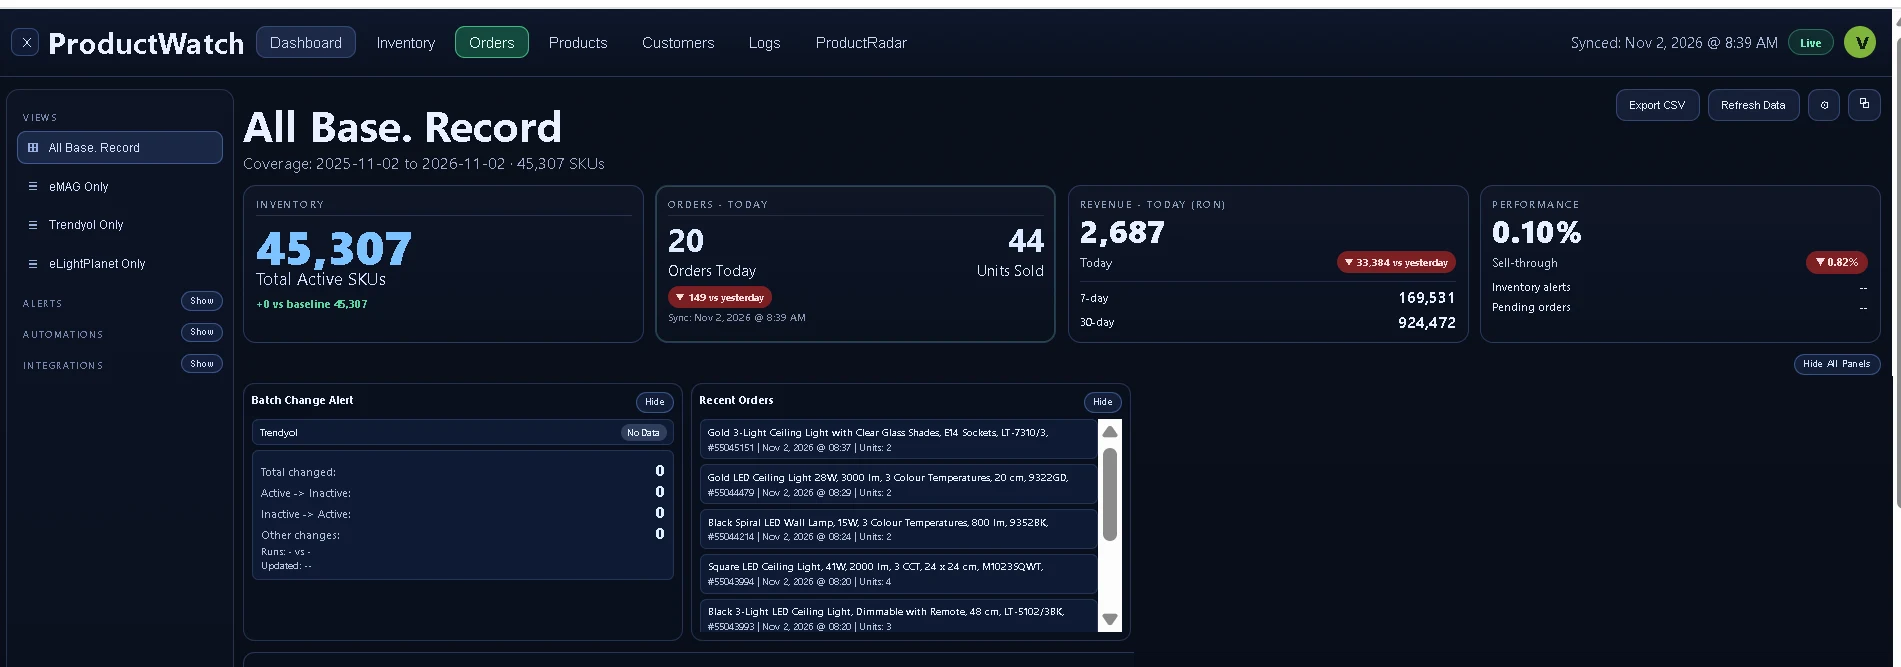
- Overview: total products, orders and revenue today, and recent orders.
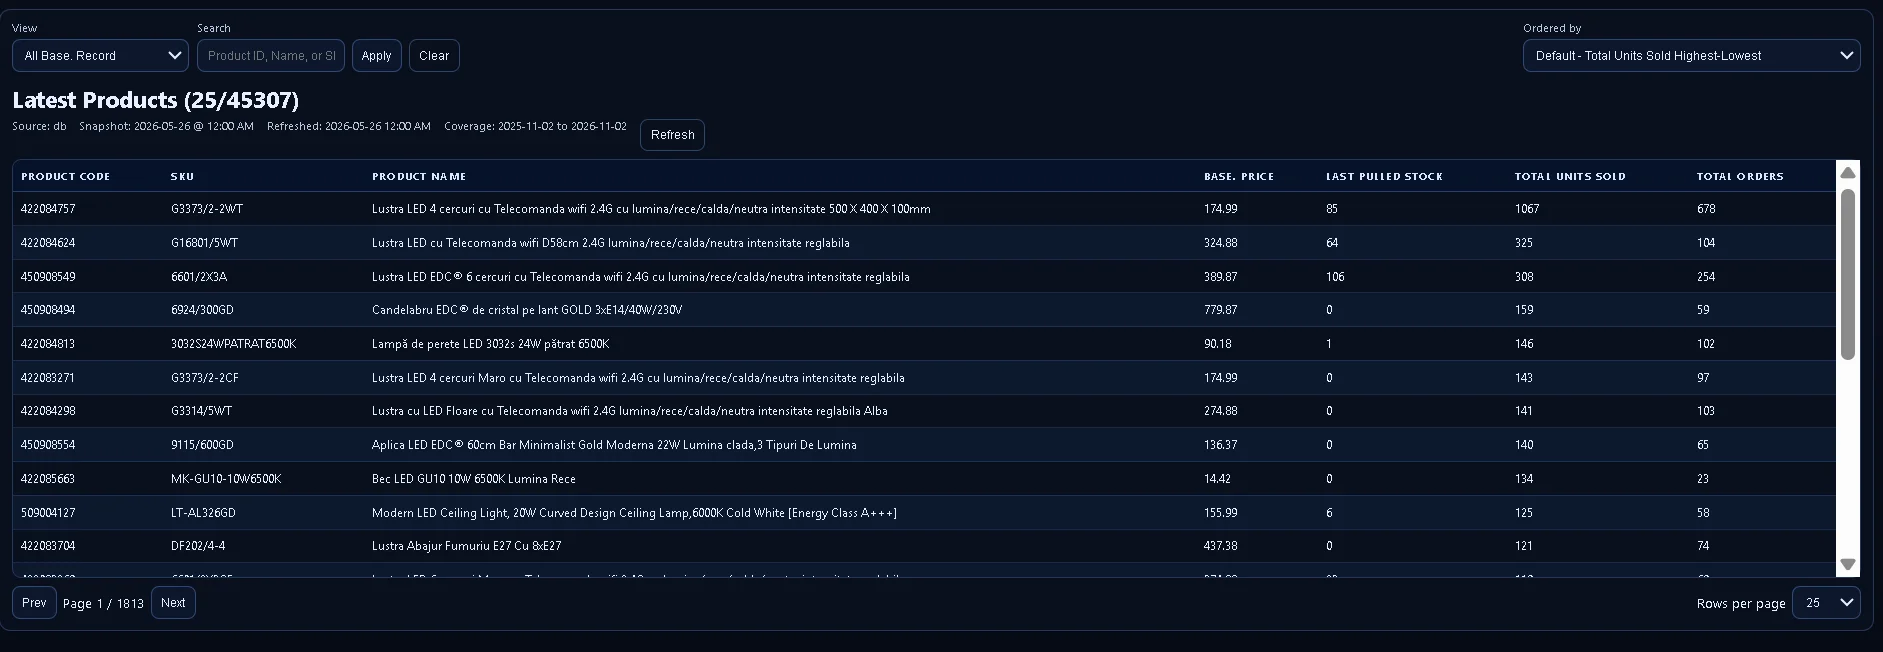
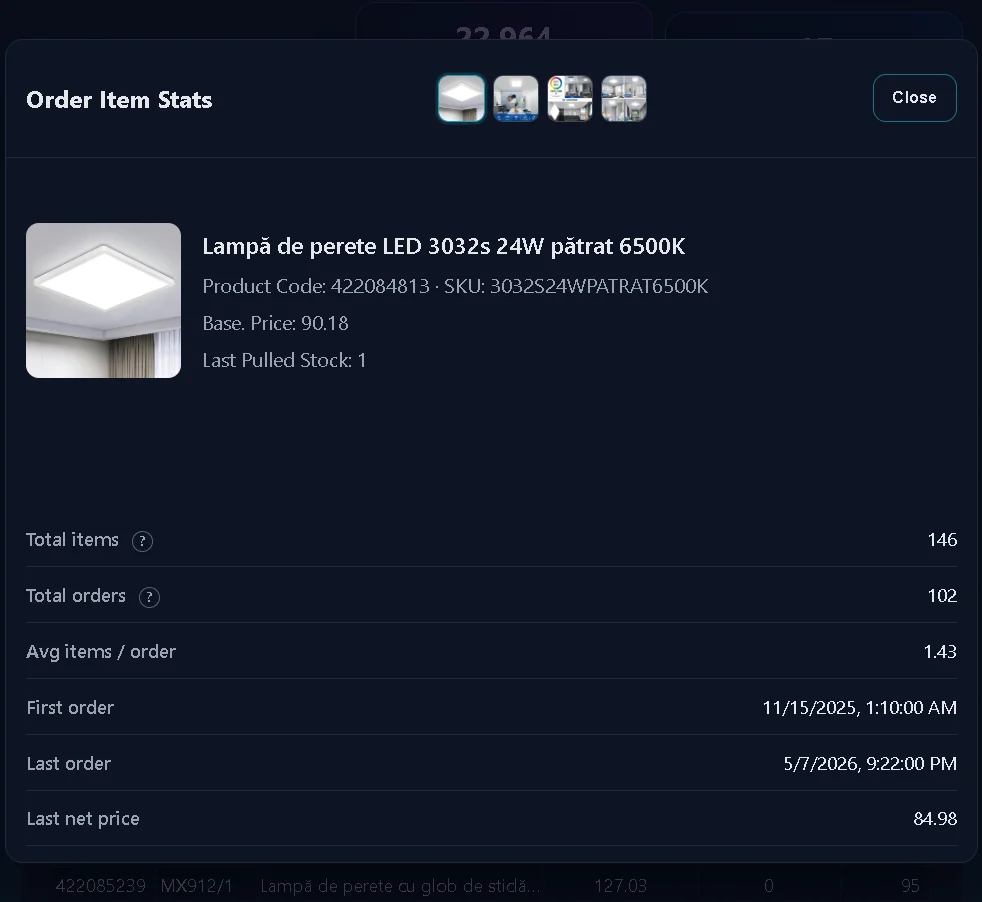
- Products: a searchable product table with stock, price, units sold and order counts, plus per-product order statistics.
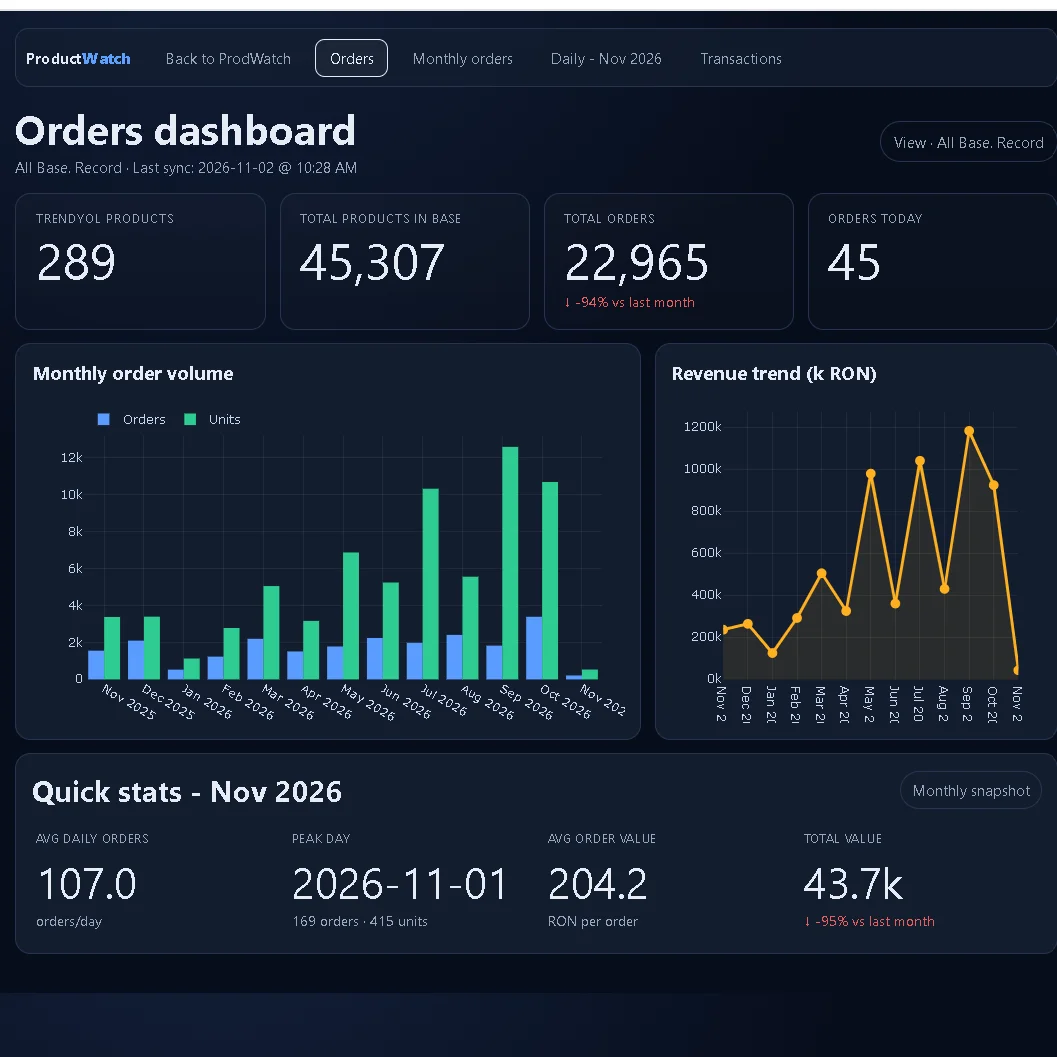
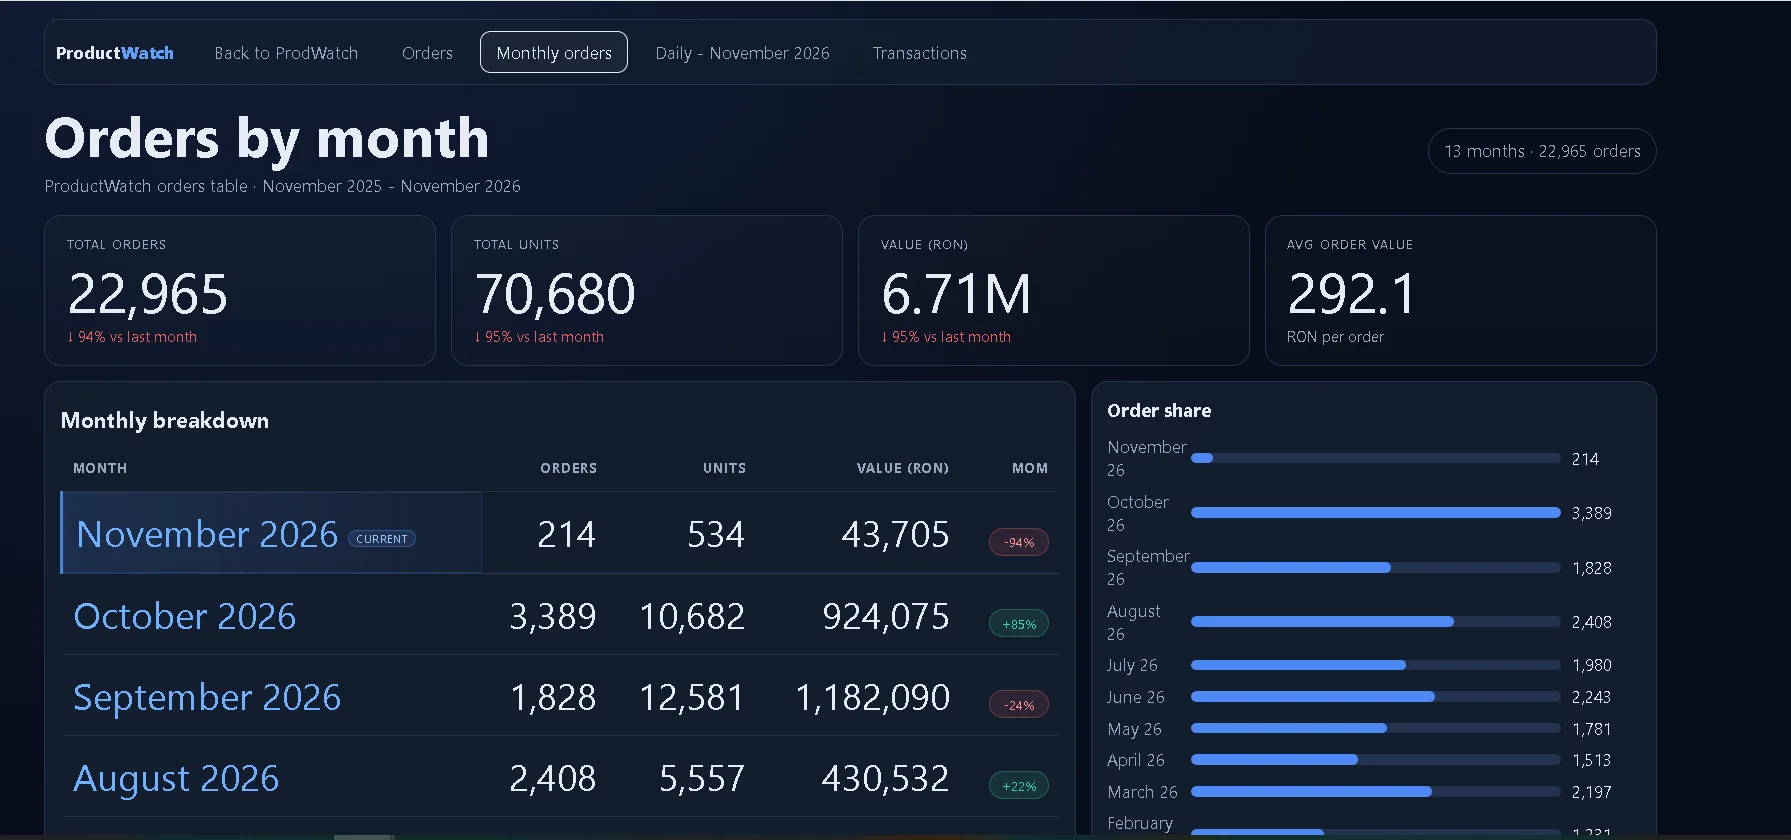
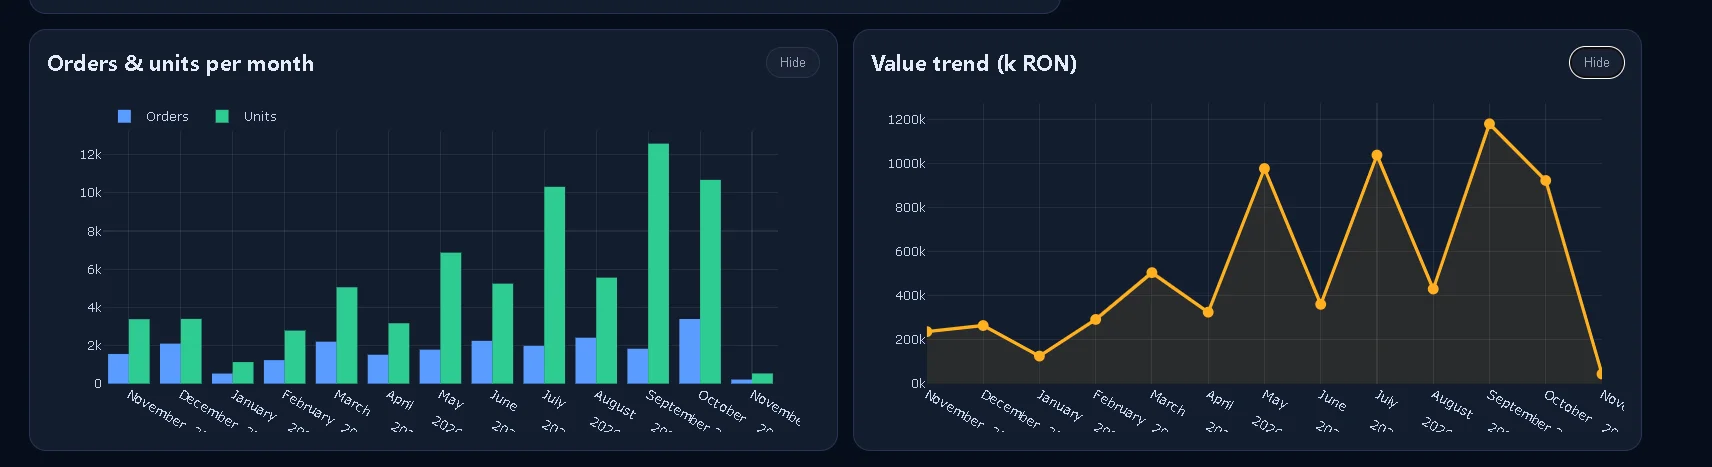
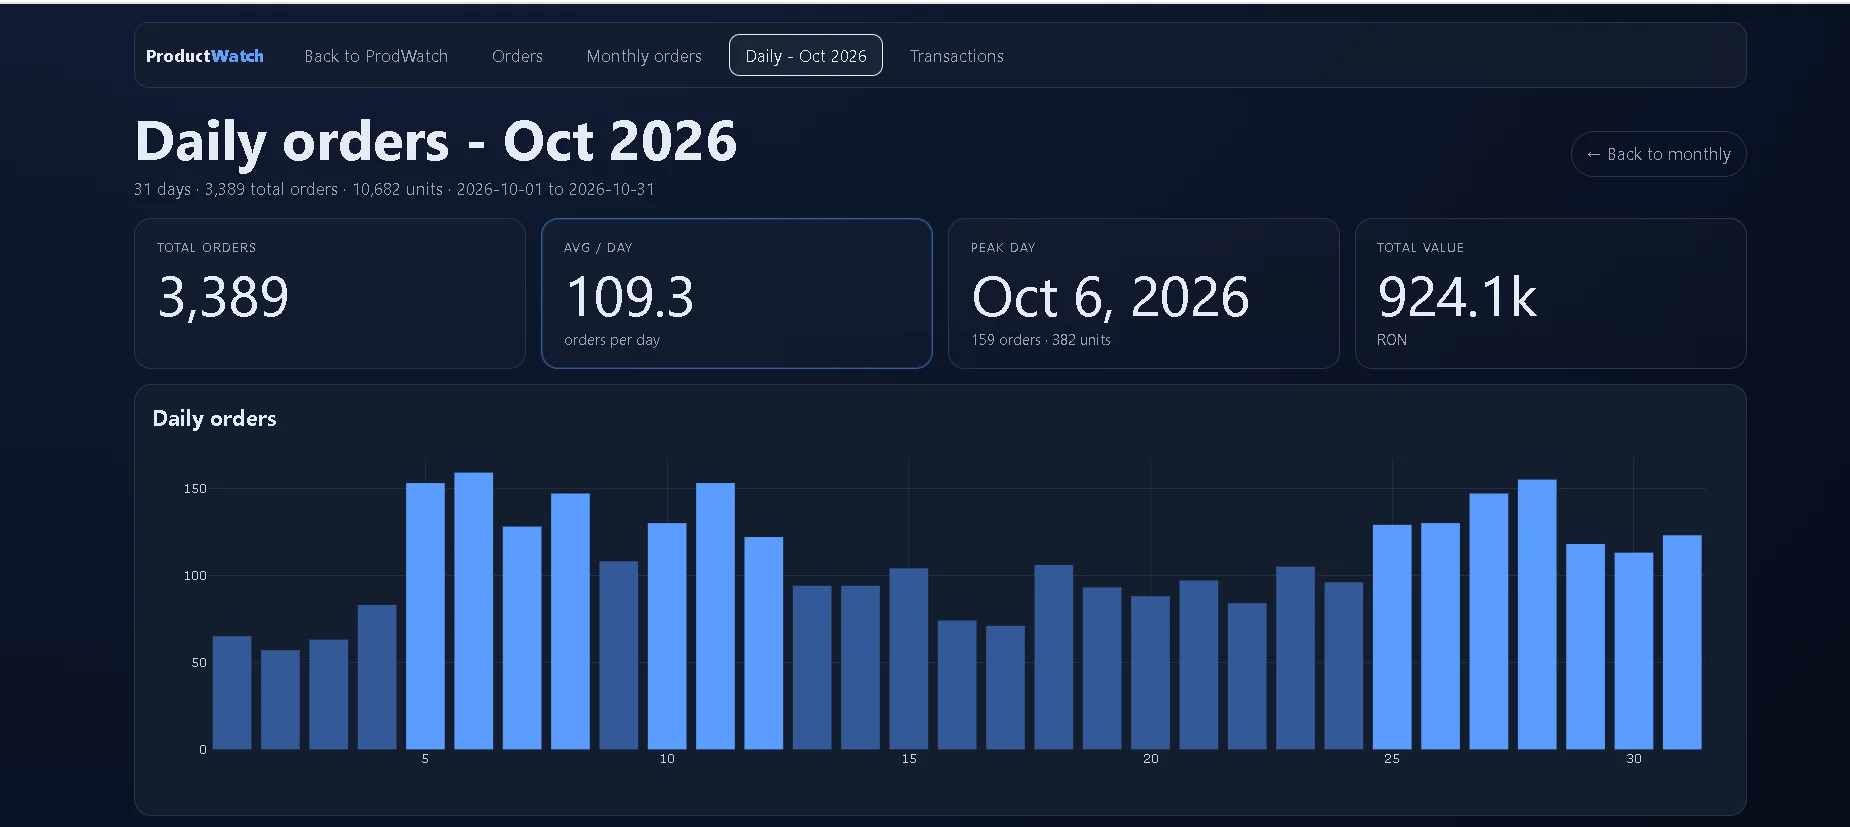
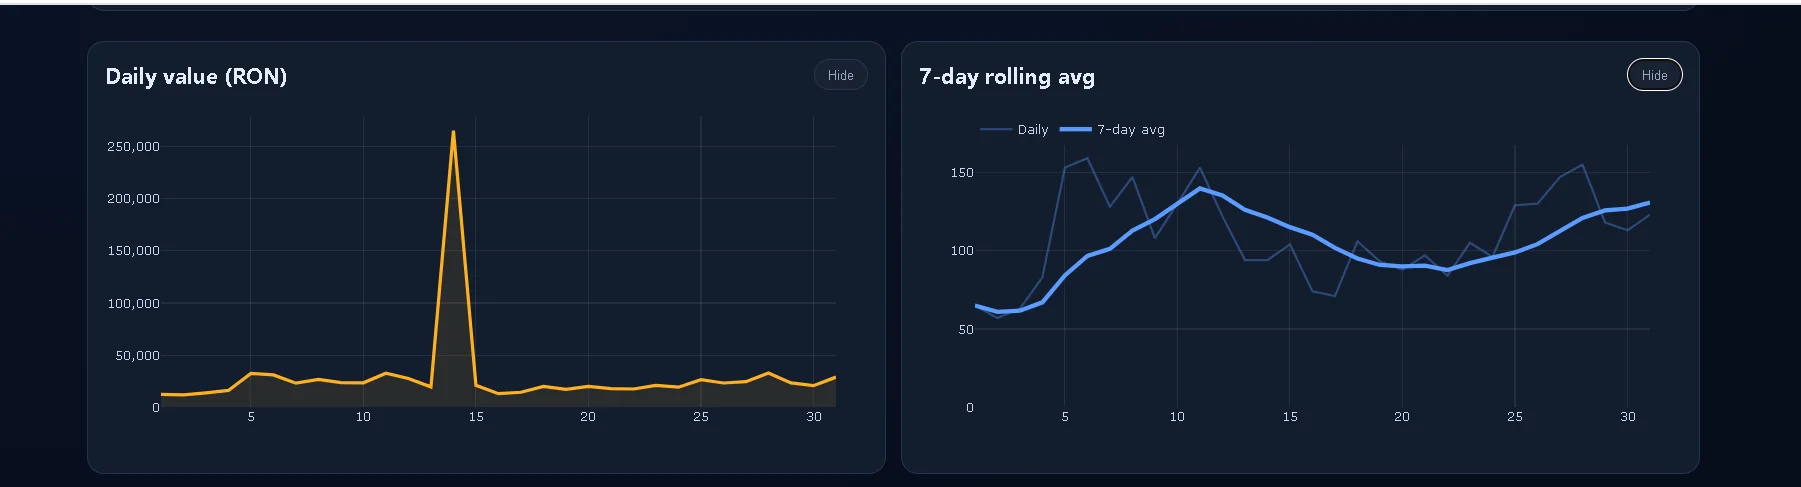
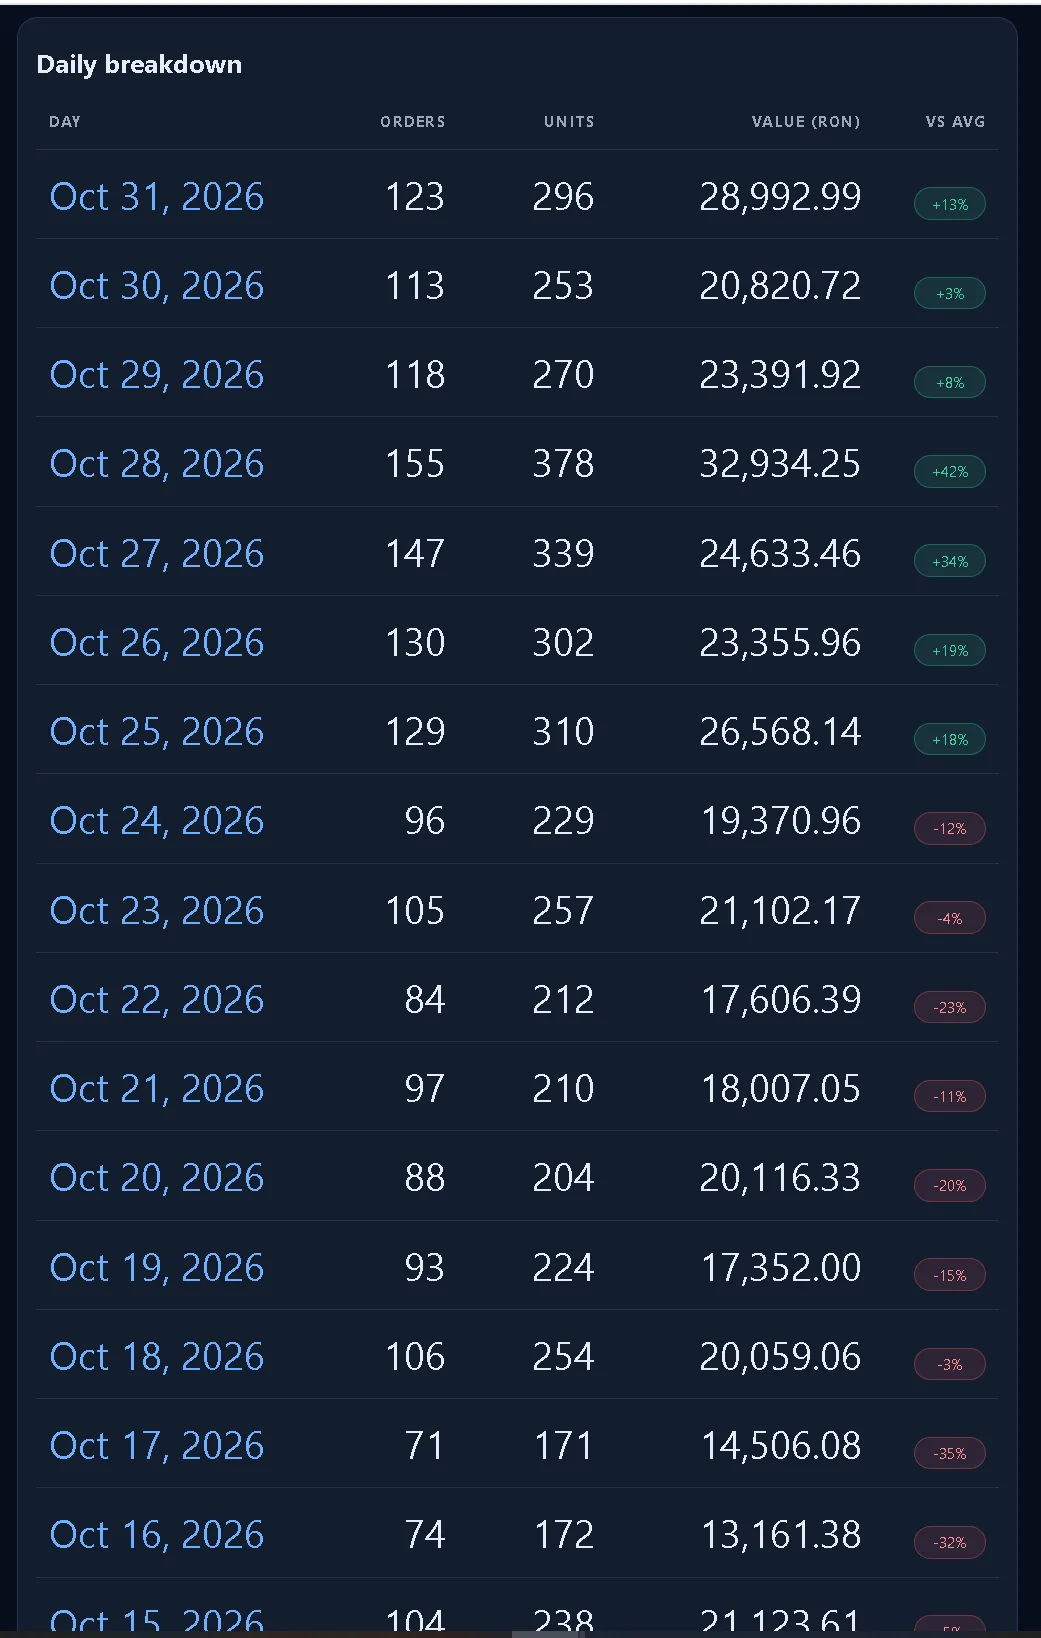
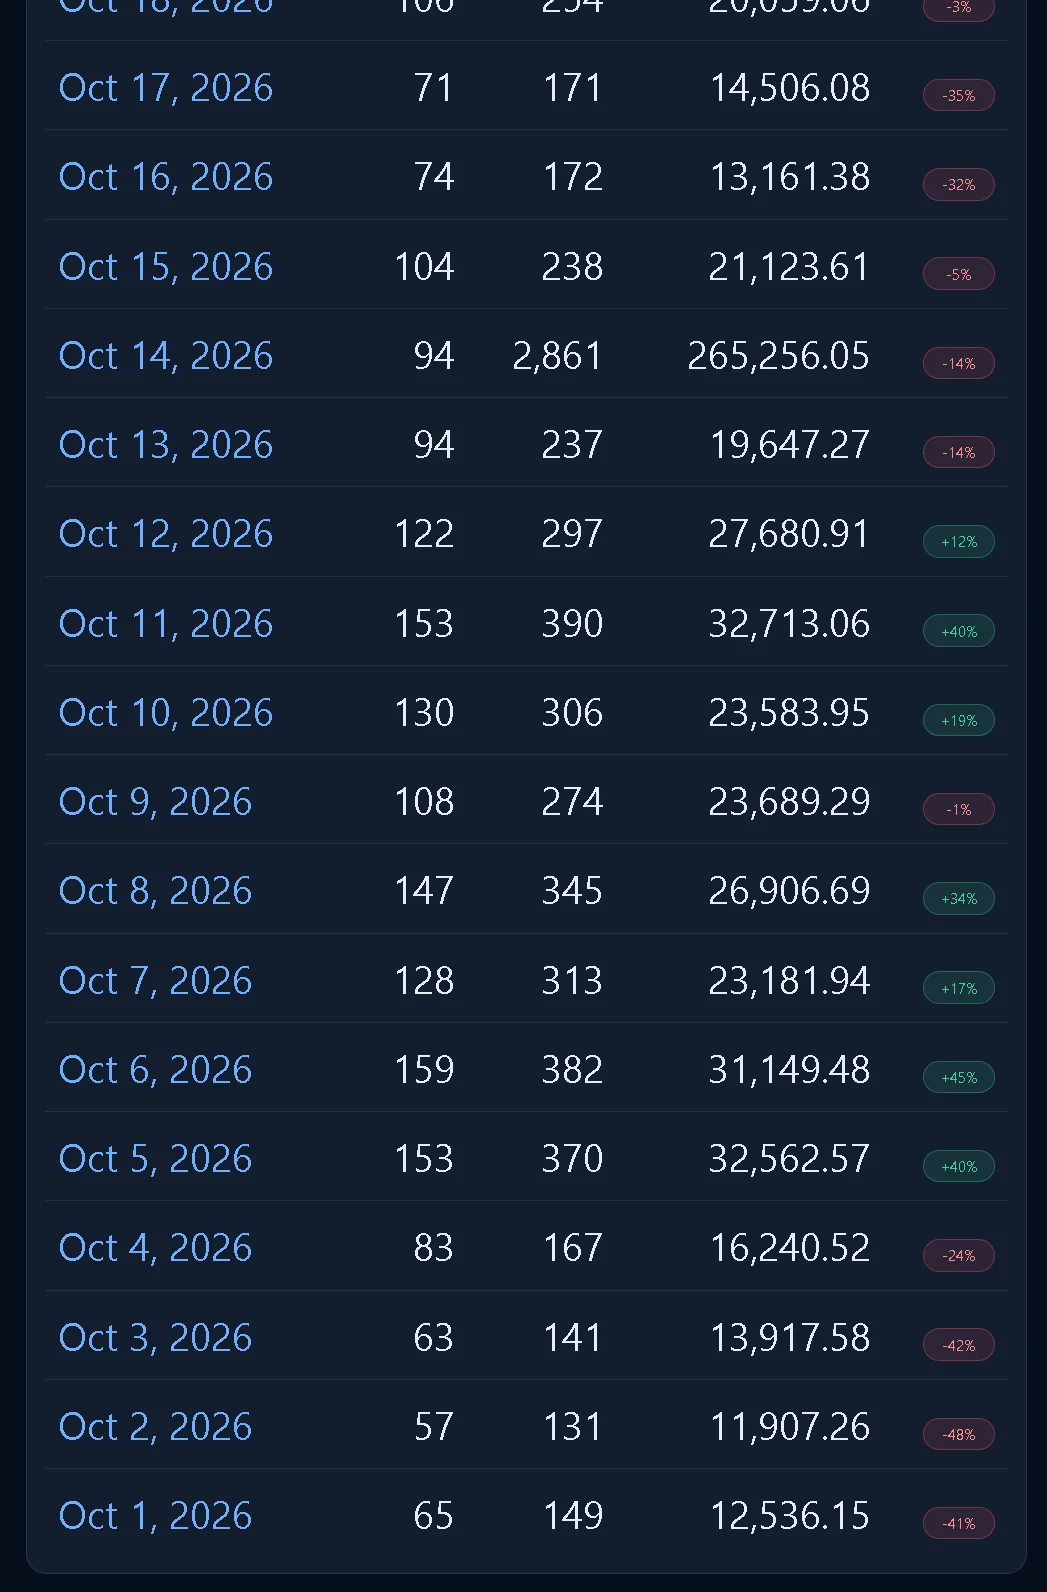
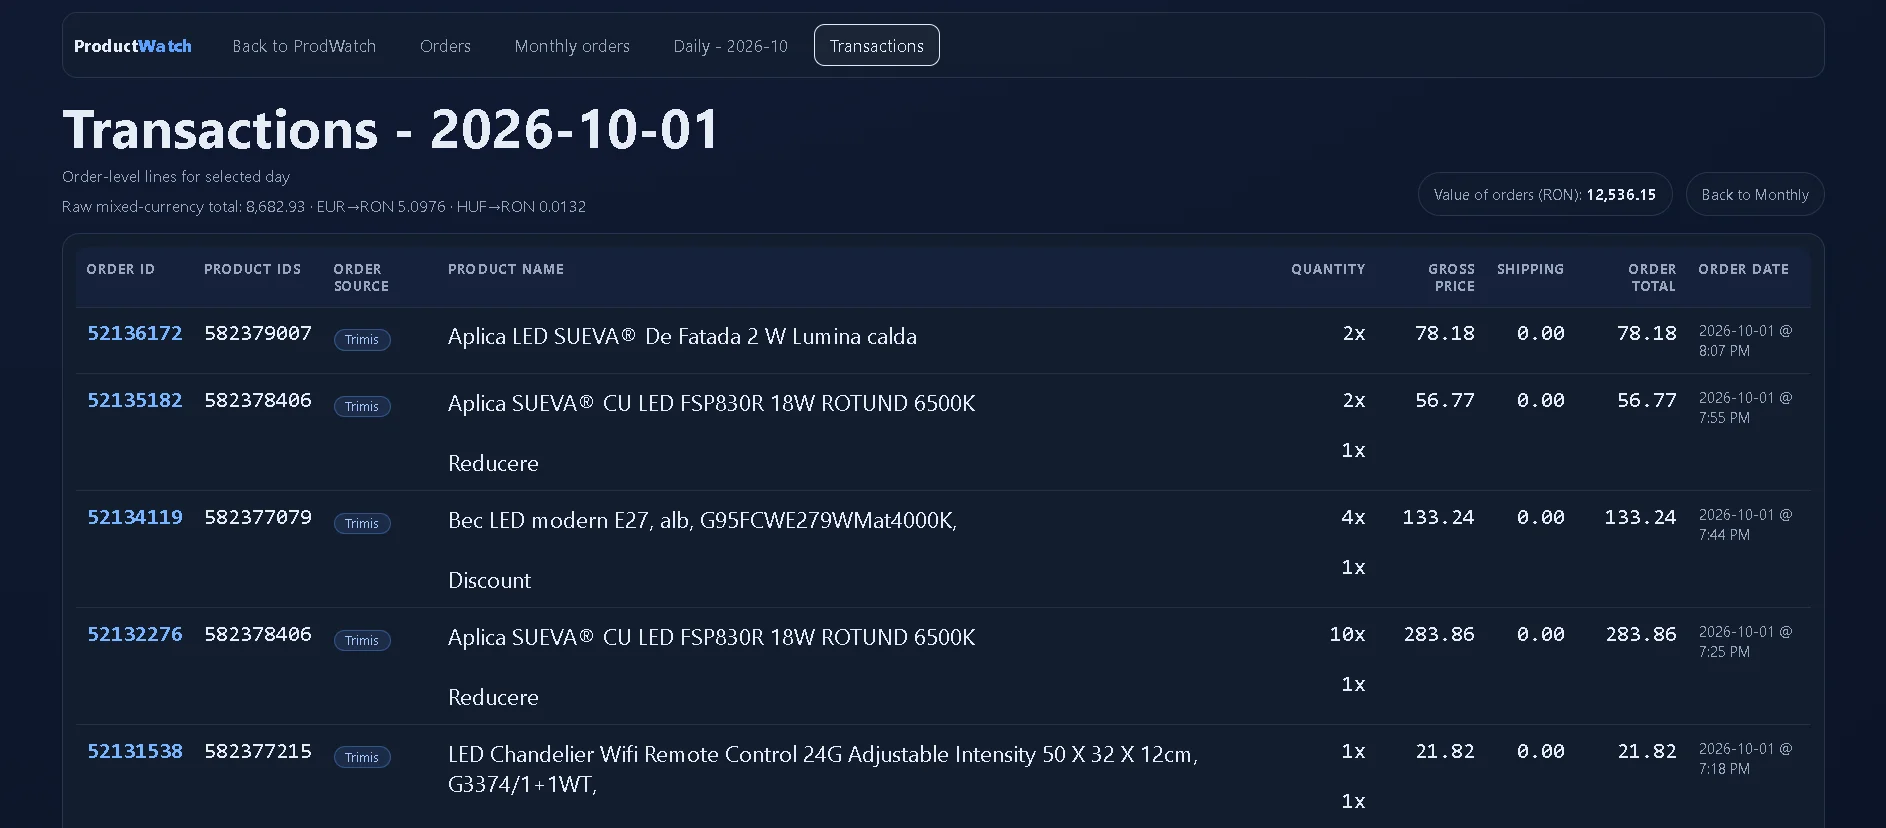
- Orders: monthly and daily order volume and value, and order lines for any day.
- Trendyol: a page for the Trendyol listings.
How it works
- BaseLinker and Trendyol
- Scheduled retrieval
- PostgreSQL
- React dashboard
What it changed
Leadership used it daily to check stock levels, orders and low-stock warnings in one place. I estimate the daily check went from 10 to 20 minutes to a few minutes. That is my own estimate, not a measured figure.
Stock warnings supported earlier reorders and supplier follow-up.
My role
I designed it and set the workflow and business rules, and built it with AI coding assistants under my direction.
Skills shown
API integration (BaseLinker, Trendyol), PostgreSQL, React and TypeScript, scheduled data jobs, order analytics, dashboard design, working with AI tools.